Research investments, manage portfolios,and explain decisions faster.
Massari is the source-linked investment intelligence platform for analysts, portfolio managers, and advisors.
Research companies, analyze earnings, monitor portfolios, optimize allocations, and produce client-ready reports from one connected dataset.Every number is linked to the source behind it.
Investment work should move faster.
Research, models, portfolios, and reports are often handled in separate workflows. Here’s where the friction shows up, and how Massari removes it.
Where work slows down
Research, filings, earnings, and financial data live in separate tools.
Figures are copied into Excel and verified again later.
Portfolio risk and exposure require separate analysis.
Research and portfolio insights must be rebuilt into reports and proposals.
Each new tool creates another handoff.
How Massari helps
Search and analyze connected financial information from one platform.
Use source-linked data directly in Excel and inspect the underlying document.
Monitor portfolios, model risk, analyze exposures, and test allocation trade-offs.
Turn current analysis into organized, decision-ready reports.
Move from research to portfolio decision to communication with fewer repeated steps.
Less time moving and checking information. More time using it.
See how Massari moves investment work forward.
An earnings call you can put your own questions to. What changed since last quarter, with the numbers behind it. Every figure clicks back to the passage it came from, including the answers you get.
An AI analyst that has read every filing, and shows its work. Ask in plain language and the AI answers from the documents themselves, numbering each claim to the passage it used so you can click straight to the highlighted text.
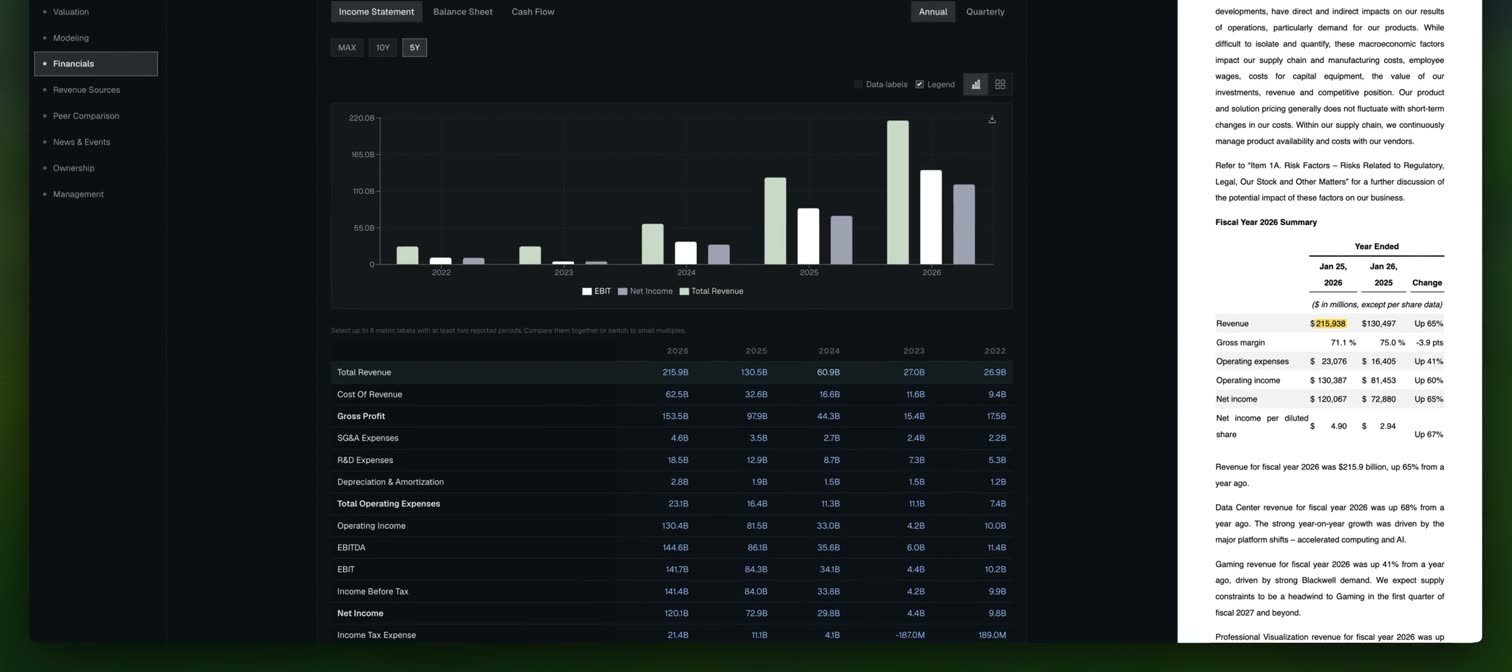
Data you don't have to take our word for. Click any line in the income statement, balance sheet or cash flow and the company's own filing opens beside it, that exact figure highlighted. Seeing is believing.
Revenue is one number until you break it apart. Product, segment and geography, back as far as the filings go, so you can see which lines are actually carrying the growth.
Screen 19,000+ symbols across 160+ metrics, all in natural language. Then see the criteria it actually used. Explicit, editable, and yours to save or export.
Every portfolio in one heatmap, sized by value and colored by the day. Open the one that moved and the explanation is already there: contribution by position, exposure by sector, drift from target, and news targeted to those exact holdings.
Performance and risk, asset by asset, so you know what a position brings before it's in the book. Sharpe, Sortino and Calmar against the benchmark, the factors it's exposed to, and every drawdown with how long it took back.
Risk you can put a probability on. Value at risk, expected shortfall and tail metrics, each against your benchmark, with a forward view built by resampling real returns rather than fitting a curve.
Most optimizers hand you weights. This one hands you the trade-off: solve for maximum return, minimum volatility, maximum Sharpe, minimum CVaR and many more objectives under your own constraints, and see the drawdown it costs as clearly as the return it buys.
Build a portfolio of portfolios. Weight the ones you already run into a single composite, and the blend is analyzed as one: its own return and drawdown, plus where the holdings overlap and how they correlate.
Your portfolio is an instrument too. Get a holistic view of its technical strength or weakness, measure breadth and correlation across the holdings, then see the forward returns each of those states has historically preceded.
Analyze volume and order flow directly on the chart. Visualize the market's auction with volume profile, or add any of over a dozen other studies, from executed-trade bubbles and session levels to gamma walls, each served live.
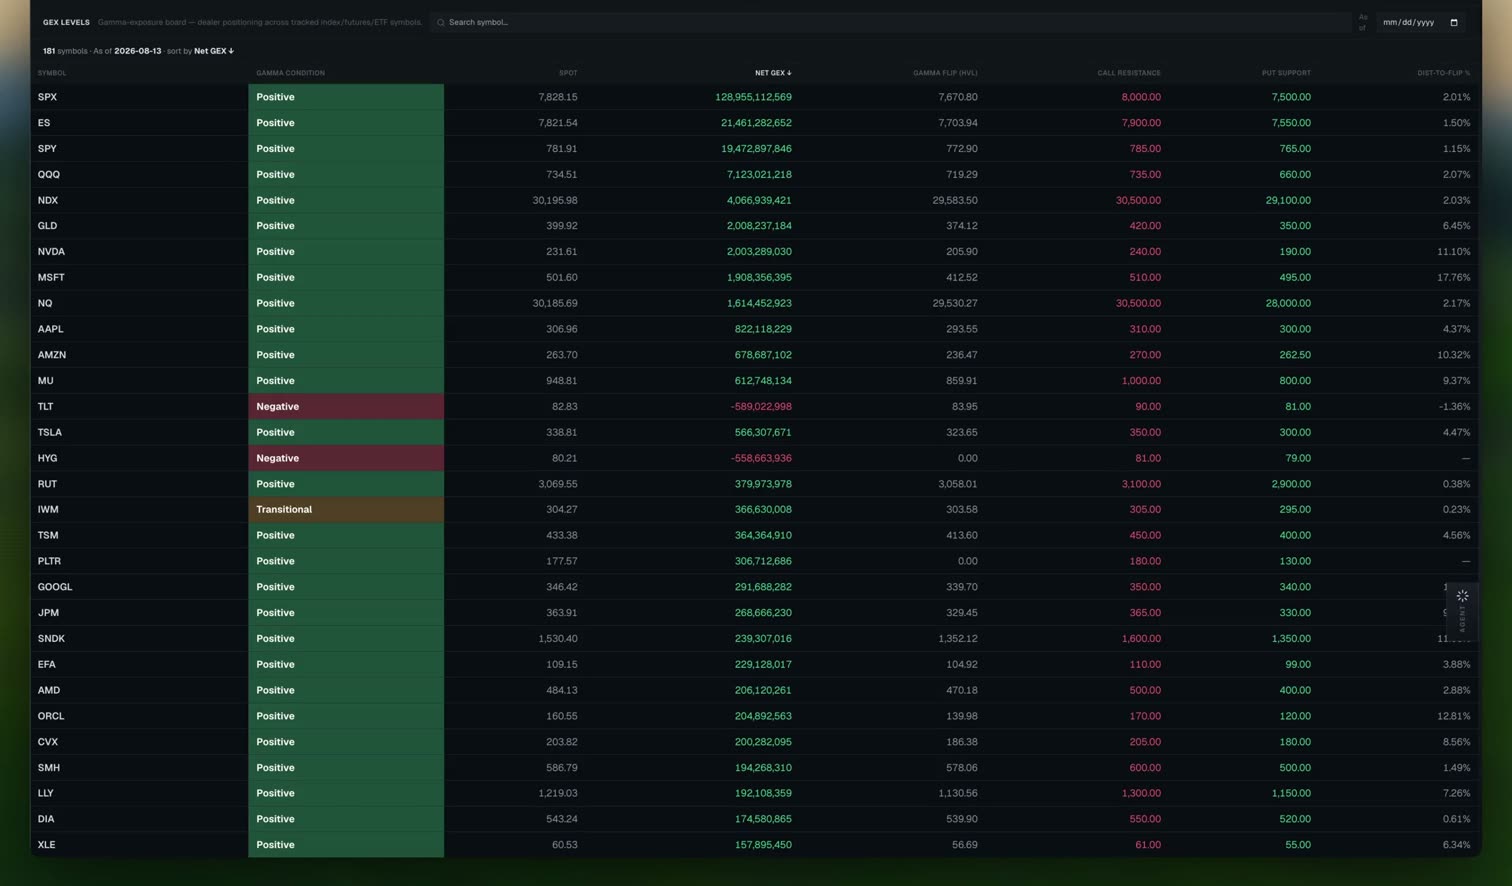
Scan gamma exposure across every tracked index, futures and ETF symbol and see where dealers are long or short gamma. Open any one and its key levels are already drawn on the chart, with GEX by strike plotted as a histogram beside them.
Statistical evidence on 50+ trading setups, from gap fills and expected ranges to seasonality, event days and dealer-gamma level reactions. Get the data you need to feel confident before you ever risk a dollar on a trade.
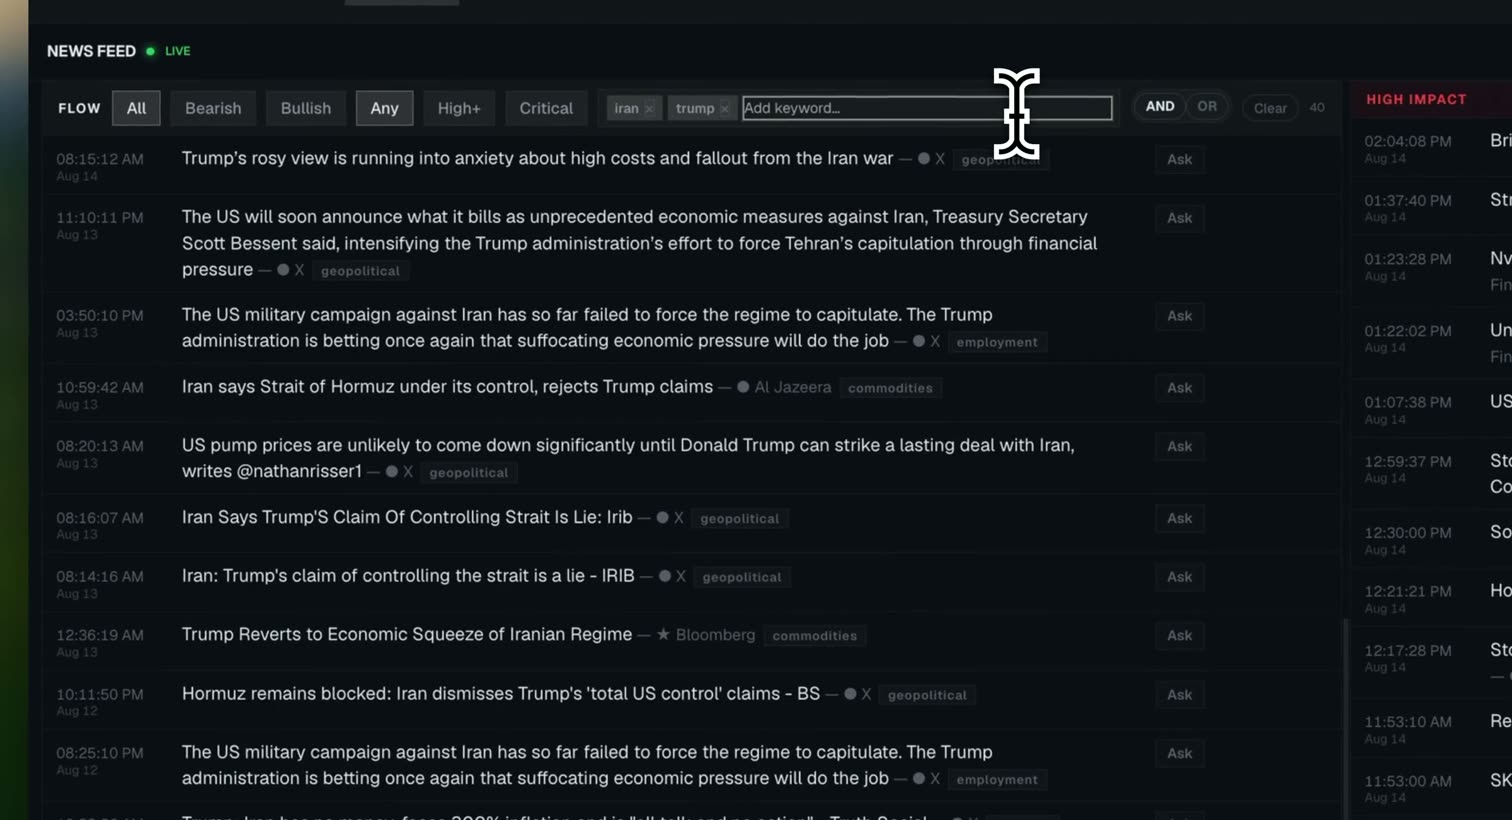
A real-time news feed with keyword search and boolean rules, so you see only what you asked for. The economic calendar sits beside it, along with technical signals on your portfolio, watchlists or any tickers you choose.
Investment research slows down when every number has to be checked somewhere else. Massari links figures and claims directly to the filing, transcript, ownership disclosure, insider transaction, or market source behind them. Verify the work as you do it, not after it has already moved into a model, memo, or client report.
Find it. Verify it. Use it.
Massari works where you work.
Use the same source-linked dataset in the terminal, Excel, Claude, ChatGPT, APIs, and the reports your team already produces.
Ask faster. Verify immediately.
Connect Massari to your AI tools with financial data and source evidence attached to the answer. The output arrives ready to inspect instead of creating another research task.
Learn more →
Update models without rebuilding the data layer.
Pull live, source-linked financial data into the workbook your team already uses. When new filings arrive, the model does not have to begin again from zero.
Learn more →Two ways in. One dataset.
One source-linked dataset, available wherever investment work happens: the Massari terminal, Excel, AI tools, APIs, and internal workflows.
 Massari Terminal
The whole investment workflow in one place.
Research companies, analyze earnings & filings, screen the market, monitor portfolios, model risk, optimize allocations, and produce reports without switching between disconnected systems.
- Screening, fundamentals, earnings and valuation
- Options positioning and quantitative studies
- Portfolio construction, optimization and look-through
- Client-ready reports and tear sheets
 Massari API
The same intelligence inside your own stack.
Use Massari through REST APIs, MCP tools, Excel, or internal AI workflows. The figure and its source travel together.
- REST API over the full dataset
- 36 read-only tools for Claude and ChatGPT
- Any screen addressable as an API call
- Every figure returned with its source
From information to action to explanation.
Massari connects the investment workflow from finding an opportunity, to understanding it, to evaluating portfolio impact, to communicating the decision confidently.
Market intelligence
Scored, filtered news across the market, timestamped to the second, with an Ask on every headline.
Options positioning
Dealer gamma walls, flip levels and key strikes across 181 symbols, daily.
Valuation that opens
Everywhere else an LTM multiple is asserted. Here it opens as the four quarters underneath it, each one carrying the filing that reported it.
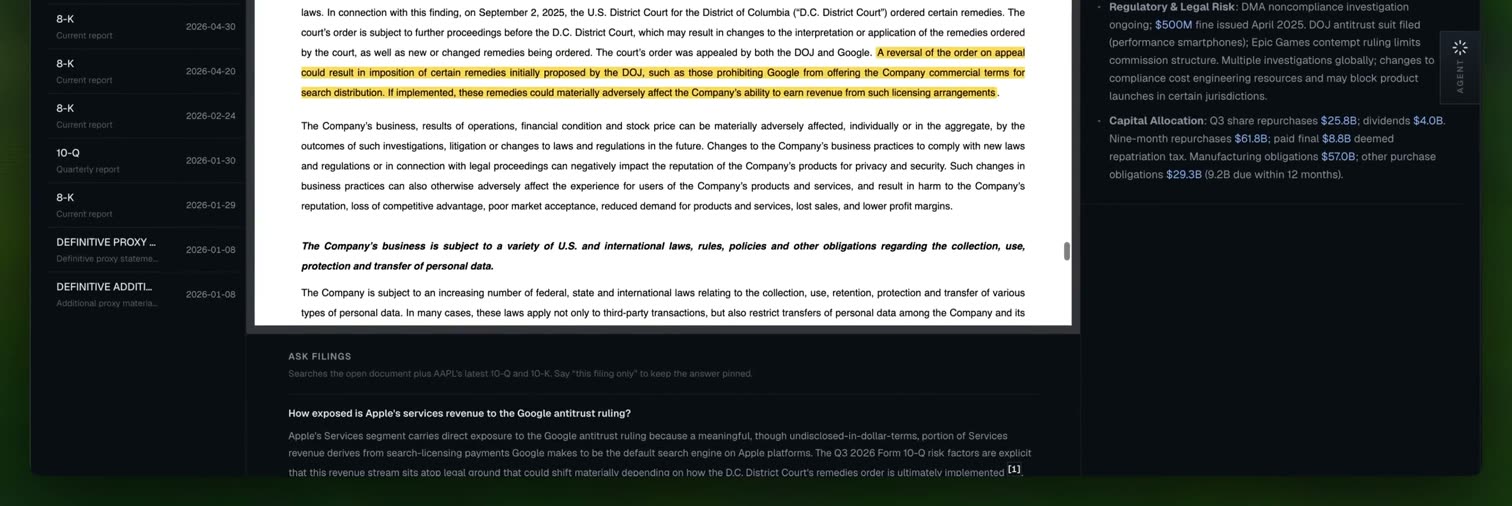
Answers that show their work
AI research you cannot check is research you have to redo. Every answer states how many claims it verified and how many it dropped for lack of evidence.
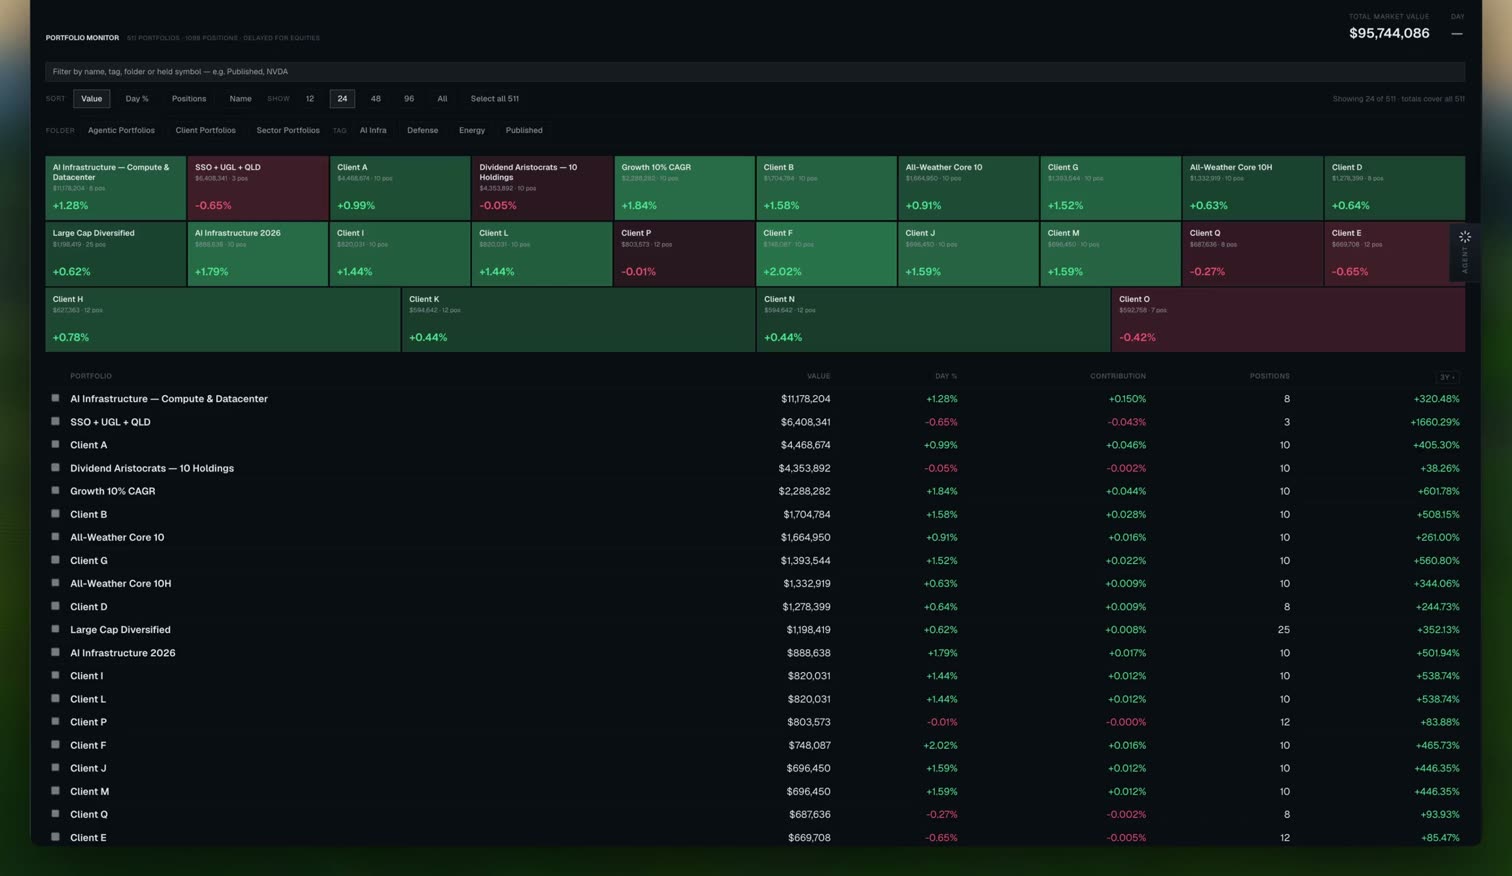
Every portfolio, one screen
Filter every portfolio by name, tag, folder or held symbol, sized by value and colored by the day.
Stop stitching the investment workflow together.
Most firms use one tool for filings. Another for earnings. Another for modeling. Another for portfolio risk. Another for reports. Massari connects those workflows through one source-linked platform.
The result is not just fewer subscriptions. It is fewer handoffs, less repeated work, and faster movement from information to decision-ready output.
Choose the Massari plan for your investment workflow.
Every plan gives you the tools to research investments, analyze portfolios, model risk, work in Excel and AI, and produce source-linked output. Start with the workflow you need today and expand as your team grows.
- One seat
- Unlimited terminal access
- Excel add-in
- MCP for Claude, ChatGPT, and Cursor
- API: monthly quota included, then metered
- Four seats included
- Add extra seats as needed
- Unlimited terminal, Excel, and MCP on every seat
- One dataset across the firm, so the numbers reconcile
- API: monthly quota included, then metered
Every seat includes
News & signals
- Every headline scored for impact and sentiment, and one click from an agent that answers what it means for the market
- Signals written as sentences that carry their own peer denominator, not a number with nothing to compare it to
- Economic calendar with actual against forecast, filtered to the impact tier you trade
- A session, week and macro read that shows the reasoning behind each call
Earnings
- Filed figures, figures said only on the call, and figures we derived are three different things on the page, and never conflated
- Click a filed number to open the SEC filing at that line. Click a spoken one to jump to the moment it was said
- Four quarters of KPIs with management commentary beside each line, clickable back to where they said it
- Which other companies talked about this one, verbatim, with the speaker and the quarter
- An agent at the bottom of the call that answers what you would have asked as the analyst on it
- Earnings calendar with consensus EPS, split before open and after close
Filings & document search
- Ask one question across every indexed filing and transcript at once, not one company at a time
- Answers state how many claims were verified and how many were dropped for want of evidence
- Every passage cited with its form, its date and the item it came from
- Scope by ticker, NAICS industry, form type, section or date before you ask
- Full filing reader with a filing-highlights rail on every document
Company analytics
- Every ratio opens as its own equation, expanding to the four quarterly filings underneath it
- Income statement, balance sheet and cash flow spanning decades of data on one grid, chartable against price
- Revenue by product, segment and geography exactly as the filer reported it, with the reporting change visible when it happens
- Beta and r-squared to 24 macro and theme cohorts, ranked by variance explained rather than by beta
- Forward estimates from our own operating model, versioned, and never analyst consensus
- Click any monthly return for an explanation that names its evidence and refuses to claim causation from timing
Ownership, funds & countries
- Any institutional manager by name, with position history that tells a sold position apart from a missing disclosure
- A simulated equity curve that rebalances on the date each filing became public, not on quarter end
- Fund disclosures and manager disclosures shown side by side and never combined, because they count different things
- Distribution health on any income fund: headline yield next to true income yield after return of capital, with the issuer’s own return-of-capital notice behind each payment
- Eighteen pages per country, from central bank boards to manufacturing detail, joined to what you already own
- Cohort return, valuation and breadth across every sector, industry and theme
Screening & lists
- Comprehensive multi-asset criteria, including insider flow, institutional flow, factor betas and yield health
- Describe a screen in plain English and get editable criteria back, not a black box
- Every screen states how much of the universe it actually searched, and why the rest was excluded
- Survivorship is a toggle, so delisted names are in or out by your choice
- Turn any screen into a watchlist, a portfolio, or an API call
Portfolios
- Ten optimization objectives from maximum Sharpe to minimum CVaR, with eleven constraints and per-holding pins
- Monte Carlo on 5,000 block-bootstrap paths of the portfolio’s own returns, resampling real history rather than fitting a curve
- Look through your ETFs to what you actually own, including the overlap between funds you thought were diversifying
- An efficient frontier across your own portfolios that says how much return is available at the same risk
- Live monitor with drift against target, contribution to the day and news scoped to your holdings
- Fifteen client report templates and a tear sheet on every portfolio
Trading
- 36 chartable series, so revenue, EBITDA or P/E sits on the same axis as a one-minute price chart
- Every series labelled live or derived, so you know which lines the platform computed
- Dealer gamma across 181 tracked symbols, with the flip, the walls and the 0DTE variants
- Volume profile and executed-trade order flow on futures
- 60 quant studies with forward-return statistics, each shipping its own methodology note
- A breakout scanner that prints the historical base rate, and says it is still collecting data when it has none
Build on it
- REST API over the full dataset, and any screen copies straight out as an API request
- MCP tools that put the same data inside Claude and ChatGPT
- Native Excel export with live formulas on valuation, modeling and financials
- Every figure returned with its citation
- Built from the documents companies file, the calls they hold, and exchange market data
Built for anyone who cares about data quality.
Anyone can produce a figure. The work is defending it in a meeting, in a review, or to a client. That is the part Massari is built around.